Showing posts with label OBIEE Presentation Server. Show all posts

Disable Auto preview of results

The results of an analysis are displayed when editing views of data.
If you prefer that the content designer explicitly asks to view the results, then you can create an XML message that specifies that auto-preview should be disabled when new views are created. The content designer can still click the Display Results link to view the results when editing a view.


The following XML code example disallows the auto-previewing of results when working with a view in Answers.
<?xml version="1.0" encoding="utf-8"?>
<WebMessageTables xmlns:sawm="com.siebel.analytics.web.messageSystem">
   <WebMessageTable system="Answers" table="ViewDefaults">
<WebMessage name="kuiCriteriaDefaultViewElements" translate="no"><HTML>
   <view signature="tableView" showToolBar="true" showHeading="true />
   <view signature="pivotTableView" autoPreview="false" />
   <view signature="titleView" autoPreview="false" />
   <view signature="viewSelector" autoPreview="false" />
   <view signature="htmlviewnarrativeView" autoPreview="false" />
   <view signature="tickerview" autoPreview="false" />
   <view signature="htmlview" autoPreview="false" />
</HTML>
</WebMessage>
   </WebMessageTable>
</WebMessageTables>

Oracle Business Intelligence Certication

This post will give an overview of OBI Foundation suite 11g exam.
Topics tested in this exam are:

Oracle BI and EPM System Overview
OBI EE Architecture
Oracle BI Installation
OBI EE User Interface Overview
Dimensional Modeling
Oracle BI Repository Overview
Build Basic Repository
Repository Testing and Deployment
Complex Repository Modeling
Advanced Repository Modeling
Building a Repository with Multiple Sources
Hierarchies and Level Based Measures
Using Variables
Implementation Methodology and Best Practices
Oracle Business Intelligence Enterprise Edition Security
Cache Management & Performance Tuning
MS Office Integration
Spatial Integration
Write Back within OBI EE
Essbase Integration


Here are few sample questions for the Certification Exam.

What does the Oracle BI Foundation Suite consists of ?
•    A. Oracle BI Enterprise Edition Plus
•    B. Oracle Scorecard
•    C. Endeca Information Delivery
•    D. Hyperion Financial Management
•    E. Oracle Discoverer
Answer: A,B

What does the common Enterprise Information Model provide ?
A. A Common Metadata Foundation across all data sources
B. A dimensional data model
C. ETL data dictionary
D. A consolidated model for MDX queries
Answer: A

Name the three components of a Cluster Server ?
•    A. Master Server
•    B. Repository Publishing Directory
•    C. Primary Cluster Controller
•    D. Web Server
•    E. Server Request Controller
Answer: A,B,C

Identify the two components that can be used to customize the user interface in Oracle BI Presentation Services ?
•    A. Dashboard Editor
•    B. Styles and Skins
•    C. XML Message Files
•    D. Scripts in installation folders
•    E. VBScripts
Answer: B,C

In a dimensional model, if you want to capture history for a slowly changing dimension, what methodology would you use ?
A. Type I Slowly Changing Dimension
B. Type II Slowly Changing Dimension
C. Type III Slowly Changing Dimension
D. Type IV slowly Changing Dimension
Answer: B

The import feature of the OBI Repository allows you to import objects into the repository from
•    A. Another Multi Dimensional Source
•    B. The Database
•    C. Another Repository
•    D. All of the above
Answer: B

What is the correct method to edit the Oracle BI repository ?
•    A. All major enhancements and developments should be made in the Online Mode
•    B. All major enhancements and developments should be made in the Offline Mode
•    C. Always make major enhancements and developments in the database and never on the BI Repository
•    D. Always edit the file using a text editor on the server
Answer: B

When you open a sales.rpd file in the BI Server repository directory, it displays a message “The repository sales.rpd can only be opened as Read-Only. Do you want to open it ?”. What is the correct statement ?
•    A. Oracle BI Presentation services is running
•    B. Sales.rpd file can be opened only in the Online mode
•    C. Oracle BI Server is running and Sales.rpd is the default repository
•    D. None of the above
Answer: C

What do you use to Model a schema where the dimension table and the fact table have a many t o many relationship ?
•    A. Complex Join
•    B. Aggregate Table
•    C. Helper Table
•    D. Split Table
•    E. Bridge Table
Answer: E

Which layer within the Oracle BI Repository provides customized, role based views to users who build analyses and other client applications ?
•    A. Physical Layer
•    B. ETL Layer
•    C. Business Model and Mapping Layer
•    D. Presentation Layer
Answer: D

OBIEE can connect natively to the following MOLAP data sources ( Check all that apply )
•    A. Oracle Essbase
•    B. Oracle OLAP
•    C. SQL Server Analytic Services
•    D. SAP BW
•    E. All of the above
Answer: E

Which layer allows you to define the data hierarchy, define dimensions and measures for multidimensional analysis and create predefined calculations ?
•    A. Presentation Layer
•    B. Business Model and Mapping Layer
•    C. Physical Layer
•    D. ETL Layer
Answer: B

What is the name of the object that is used to initalize dynamic repository variable and system session variables for OBIEE Sessions ?
•    A. Tokens
•    B. Variables
•    C. Initialization Blocks
•    D. Meta Tags
Answer: C

Why do you use Aliases in the Physical Layer of the repository ?
•    A. To remove Complexity
•    B. To hide original Objects
•    C. To enforce naming conventions
•    D. To avoid Circular Joins
Answer: D

In a multi user environment, how do you resolve project conflicts ?
•    A. The Administration tool locks projects on the server to avoid conflicts
•    B. Always delete local changes when checking in files to avoid conflicts
•    C. Conflicts are resolved during the Check-In process
•    D. Multiple users cannot work on projects at the same time.
Answer: C

When you want to schedule an Analysis to run at a pre determined timeframe, what component will you use ?
•    A. Action Framework
•    B. Scorecard
•    C. KPI
•    D. Agent

Answer: D

Security features for the Oracle BI plug-in for Microsoft Office include :
•    A. The ability to secure tables and graphs in Office applications so users must credentials to view Oracle BI Data
•    B. Support for the Oracle BI Security Model including support for both encrypted (SSL ) and Single Sign On modes
•    C. Only A
•    D. Both A & B

Answer: D

What are the tools that can be used to construct map based applications for use in Oracle BI?
•    A. Google Maps
•    B. Oracle Mapviewer
•    C. Endeca Infront
•    D. Oracle Map Information Server

Answer: A,B

How would you enable an Analysis to “listen” for Dashboard Prompts ?
•    A. Create a variable in Analysis and then Create a similar variable in the Dashboard Prompt
•    B. When building a filter in Analysis, select “Is Prompted”
•    C. By Creating an Initialization Block
•    D. Through Custom Scripting

Answer: B

Which of the following tools provide viable methods to view Essbase Data ?
•    A. Smartview
•    B. OBIEE
•    C. SQL Developer
•    D. Essbase Administration Services


Answer: A,B,D

Best of Luck for the Certification!!!!

Reference: Oracle.com

OBIEE Left Outer Join Puzzle Solved.

Issue:
Recently i was facing an issue with my report where the measures are doubled, where as i dont have any dubes in the Fact table, issue was because of the left outer join that i had as it was throwing null values the entire row is repeated twice as a result because of my aggregation defined on measure.

Sol 1:
whenever you group a colum with left outer always write a ifnull(expr, 'NA') so that distinct is counted and you wont be facing any issues.

Sol 2:
In other ways try to fig it out if you can avoid left outer by implementing a look-up on the fact.

Interaction in OBIEE

We can configure various options that change the way that right-click interactions are handled in views for an analysis at run time. These are controlled by the tags given below , to be configured in instanceconfig.xml file.

<ServerInstance>
  <Analysis>
    <InteractionProperties>
      <InteractionPropertyAddRemoveValues>true</InteractionPropertyAddRemoveValues>
      <InteractionPropertyCalcItemOperations>true</InteractionPropertyCalcItemOperations>
      <InteractionPropertyDrill>true</InteractionPropertyDrill>
      <InteractionPropertyGroupOperations>true</InteractionPropertyGroupOperations>
      <InteractionPropertyInclExclColumns>true</InteractionPropertyInclExclColumns>
      <InteractionPropertyMoveColumns>true</InteractionPropertyMoveColumns>
      <InteractionPropertyRunningSum>true</InteractionPropertyRunningSum>
      <InteractionPropertyShowHideSubTotal>true</InteractionPropertyShowHideSubTotal>
      <InteractionPropertySortColumns>true</InteractionPropertySortColumns>
    </InteractionProperties>
  </Analysis>
</ServerInstance> 


OBIEE Add Action Link to another report

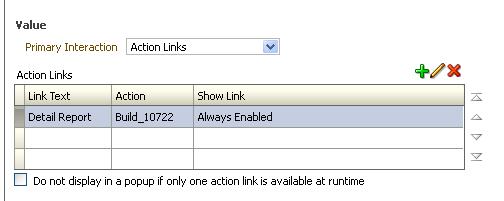
In the criteria tab of the report go to column where u want to add the action link. go to column properties ->click on Interaction -> select the Action link ->choose the type of navigation you would like to. Given below is an example where i have choosen a detail report.


Obiee Learners: MOLAP vs OLAP

MOLAP vs OLAP in terms of BI:

OLAP: Interactive Analysis of data on multiple dimensions. you can consolidate(aggreagate) ,drill down, slice and dice. Ex: all sales offices are rolled up to the sales department or sales division to anticipate sales trends.
OLAP is highly scalable, Time consuming* and provide attribute based analysis. we can implement level based hierarchies.

MOLAP: An alternate of OLAP. MOLAP differs significantly in that (in some software) it requires the pre-computation and storage of information in the cube.
MOLAP is fast, flexible, supports parent child and level based hierarchies by default.

For instance we have a analysis report on the same data, build on top of OLAP and on essbase cube. Essbase cube in some cases proven to be 300% faster than OLAP report.

Disconnected Analysis

Disconnected Analysis?
Disconnected Analytics allows users to use Oracle BI Dashboards and BI Answers when they cannot connect to the network.

Architecture:


The data in the disconnected SQL Anywhere database is sourced from the networked application.
The sourcing queries are actual BI Answers reports.  Typically the data-model within the SQL Anywhere database reflects a subset of a Presentation Layer “subject area” . we need to define new RPD for Disconnected Analysis, where the fact table is based on the column of the analysis/Reports.

OBIEE 11g Simple Installation vs Enterprise Installation


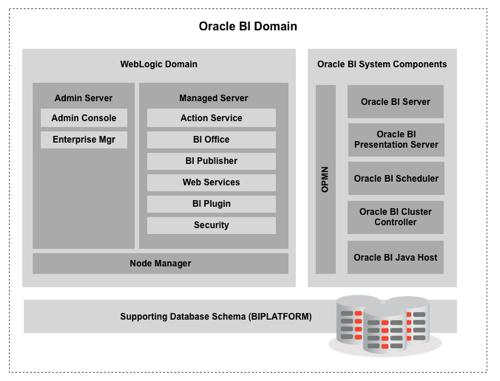
Many of us believe OBIEE 11g simple installation as laptop installation let me give some limelight on it what is the architectural difference between them.

Enterprise Installation:

Enterprise installation is designed with the view of scalability. Over time, you can scale-out this WebLogic domain to include additional managed servers on additional hosts.


Simple Installation:

In Simple Install we don't have Managed Server, along with the Node Manager server, this reduces the memory of the installation. Doing so we wont be able to scale out the BI, which is acceptable. Node Manager which is essential for inter process communication in a cluster is not needed as it is a standalone installation all the headache is own by the Admin server.

Reference:
http://www.rittmanmead.com/2011/10/oow2011-obiee-11g-architecture-internals/

Set Default currency for Dashboard


Open the currencies.xml file in the directory $ORACLE_HOME\bifoundation\web\display

I want to set Default currency as $ to do this.

Step 1:

Currency element for dollar is : 

<Currency tag="loc:en-US" type="local" symbol="$" locale="en-US" format="$#" digits="2">
      <negative tag="parens" format="($#)" />
      <negative tag="minus" format="-$#" />
</Currency>

if you want the dollar symbol as USD instead of $ use this:

<Currency tag="int:USD" type="international" symbol="USD" locale="en-US" digits="2"/>

Step 2:

Search for the text string int:wrhs and replace it with the copied element.

Replace the tag attribute so it reads int:wrhs
ex: replace tag="int:euro-l" with tag="int:wrhs".

<Currency tag="int:wrhs" type="local" symbol="$" locale="en-US" format="$#" digits="2">
      <negative tag="parens" format="($#)" />
      <negative tag="minus" format="-$#" />
</Currency>

Hide Obiee Page on a condition

I had a requirement where i was to hide a dashboard page on the result set of another report.

This is how it can be achieved:

Add a section to the dashboard page to which you want to hide dashboard page:

Add the following script in the section:

<script type="text/javascript">

function hidePage()
{
  var body = document.getElementsByTagName('body')[0];
  var tablecolums = body.getElementsByTagName("td");
  var tabletd;

  for (i = 0; i < tablecolums.length; i++)
    {
    tabletd = tablecolums[i];
    if(tabletd.className=='TabDimCell')
    { tabletd.style.display = "none";}
    }

}
hidePage();

</script>


Once you have the script in place you can use guided navigation on the text and use a condition to enable the text and thus we achieve our target.

OBIEE Catalog Replication

Usually catalog can be migrated between the environments but if we have a scenario where u want to replicate the catalog between env then u can follow this:

Why i choose replication?

I have server 1 which is supposed to be used exclusively for analysis and have server 2 which was exclusively for just running Dashboards(wired thought of clients). I would have used the same catalog shared between the servers but i choose to replication services. The Replication Agent (whose file name is sawrepaj) is a utility that performs common replication tasks such as copying, exporting, importing, and marking for replication.


Configuring Replication:

cd $ORACLE_HOME\bifoundation\web\bin

Step 1:
create a config file for replication:
lets save this config file as   $OracleHome\bifoundation\web\bin\config.xml
 
<Config>
      <General>
         <ExportDirectory>\\host1\shared</ExportDirectory>
         <LogExpiresHours>48</LogExpiresHours>
      </General>
      <Server name="1" user="<admin1user>" pwd="<admin1password>">
        <Property name= "oracle.bi.presentation.url"
        value ="http://host1.com:<port>/analytics/saw.dll"/>
        <Property name="oracle.bi.presentation.usesoaptcptransport" value="N"/>
      </Server>
      
      <Server name="2" user="admin2user" pwd="admin2password">
      <Property name="oracle.bi.presentation.sawservers"
        value ="localhost:10712"/>
      <Property name="oracle.bi.presentation.usesoaptcptransport" value="Y"/>
      </Server>

      <Folderset name="all">
         <Folder>/</Folder>
      </Folderset>

      <ReplicationTask destination="2" source="1" folders="all" />
   </Config>
 
Step 2: 

Enable Replication in the instanceconfig
 
 
<Catalog>
  <Replication>
    <Enabled>true</Enabled>
    <ReadLogRecordsSinceHoursAgo>120</ReadLogRecordsSinceHoursAgo>
    <RecordsInFileLimit>4000</RecordsInFileLimit>
  </Replication>
</Catalog> 

Step 3:


I just want to replicate everything in config.xml file  so i run it as
 
sawrepaj $OracleHome\bifoundation\web\bin run


OBIEE Performance Guidelines

The following guidelines are applicable for both OBIEE 11g and OBIEE 10g
 
Identify the BI Component( BI Server, Presentation Services or the database connectivity) that could have contributed to the issue.
  • Check if physical Sql run by user contributed to the issue.
  • If the sql runs quickly then Presentation Services might be taking more time to display the results. This will happen if you have a significant number of chart or pivot views for the reports. Check if changing the existing reports to table views improves performance.
  • If the physical SQL is taking a long time, performance tuning needs to be done on the database. Most databases have many parameters and advanced features that will help run the queries efficiently. DBAs can help tune the database for these slow running queries. Oracle Database features like proper indexing, partitioning and Star Transformations can help performance to a great extent.
  • Enable Usage Tracking and see what are the user actions performed and analyze what could have contributed to the issue.
  • Caching can be very helpful in alleviating performance issues for complex queries that are used many times. iBots can be used to seed queries during off peak hours to achieve improved performance.
  • Disable unused init blocks and consolidate the other init blocks. It is a good idea to create SQL in the init blocks to populate many variables instead of having many simple init blocks.
  • Check how many rows are being retrieved. The OBIEE should not be used to display hundreds of thousands of rows, instead use reports that are filtered and aggregated by some attributes.
  • Too many pivot and chart views on a dashboard page can make the UI very slow to display.  Check for hidden sections and guided navigations that always run.
  • Guided Navigation when used we should realize that all the reports underlying in that section will be executed and only the report that satisfies the condition will be displayed. It is highly possible that in such cases report will run without any filters on it.
  • Depending on the ability of the database to handle certain functions, the DB features tab should be set appropriately in the repository. From the physical layer click on Database to see the DB Features tab. If one of the database features is turned off, incorrect SQL might be generated by OBI. This might be expensive in terms of performance. Check if any features have been changed.
  • The repository should be designed according to best practices. De-normalize dimensional objects, combine several dimensional attributes into one flat table. This will help reduce joins. Model your physical tables in a way that should help in creating simpler Business Models.
  • Use Aggregate Tables when necessary to improve performance. Aggregate tables will need additional ETL, storage and complex mapping efforts.
  • If you have complex logic that involves complex SQL, it is a good idea to consider pushing this logic to ETL rather than handling it in the repository.
  • For a large number of concurrent users, use the following guideline for the maximum number of connections in a connection pool:
      20% of concurrent users * number of reports per dashboard
  • Perfmon logs gather memory usage statistics. They are especially useful when the entire application becomes slow some time after start up. Check if the application responds quickly after restarting the services. If you start seeing issues after some time of using the application, this might indicate you have memory-related issues.
    On Unix, use the following commands to gather performance statistics:
    ps -ef|grep <obi process>
    top